A management & maintenance magazine for school transportation fleets
Issue link: https://sbf.epubxp.com/i/229350
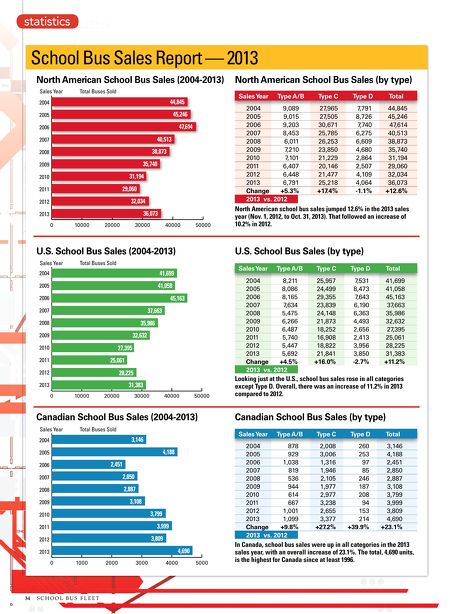
statistics School Bus Sales Report — 2013 North American School Bus Sales (2004-2013) Sales Year Total Buses Sold Sales Year 44,845 2004 47,614 2006 40,513 2007 38,873 2008 35,740 2009 31,194 2010 29,060 2011 32,034 2012 36,073 2013 0 10000 20000 30000 40000 4 50000 U.S. School Bus Sales (2004-2013) Sales Year 41,058 37,663 2007 35,986 2008 32,632 2009 27,395 2010 25,061 2011 28,225 2012 31,383 2013 0 10000 20000 30000 40000 50000 Canadian School Bus Sales (2004-2013) Sales Year Total Buses Sold 2,451 2006 2007 2,850 2008 2,887 3,108 2009 3,799 2010 3,999 2011 3,809 2012 4,690 2013 0 34 1000 SCHOOL BUS FLEET 2000 3000 44,845 45,246 47 ,614 40,513 38,873 35,740 31,194 29,060 32,034 36,073 +12.6% 4000 5000 Type C Type D Total 25,957 24,499 29,355 23,839 24,148 21,873 18,252 16,908 18,822 21,841 +16.0% 7,531 8,473 7,643 6,190 6,363 4,493 2,656 2,413 3,956 3,850 -2.7% 41,699 41,058 45,163 37,663 35,986 32,632 27,395 25,061 28,225 31,383 +11.2% Canadian School Bus Sales (by type) Type A/B 2004 878 2005 929 2006 1,038 2007 819 2008 536 2009 944 2010 614 2011 667 2012 1,001 2013 1,099 Change +9.8% 2013 vs. 2012 4,188 2005 Total 7 ,791 8,726 7 ,740 6,275 6,609 4,680 2,864 2,507 4,109 4,064 -1.1% Looking just at the U.S., school bus sales rose in all categories except Type D. Overall, there was an increase of 11.2% in 2013 compared to 2012. Sales Year 3,146 2004 Type A/B 2004 8,211 2005 8,086 2006 8,165 2007 7,634 2008 5,475 2009 6,266 2010 6,487 2011 5,740 2012 5,447 2013 5,692 Change +4.5% 2013 vs. 2012 45,163 2006 Type D 27 ,965 27 ,505 30,671 25,785 26,253 23,850 21,229 20,146 21,477 25,218 +17.4% North American school bus sales jumped 12.6% in the 2013 sales year (Nov. 1, 2012, to Oct. 31, 2013). That followed an increase of 10.2% in 2012. Sales Year 41,699 2005 Type C U.S. School Bus Sales (by type) Total Buses Sold 2004 Type A/B 2004 9,089 2005 9,015 2006 9,203 2007 8,453 2008 6,011 2009 7 ,210 2010 7 ,101 2011 6,407 2012 6,448 2013 6,791 Change +5.3% 2013 vs. 2012 45,246 2005 North American School Bus Sales (by type) Type C Type D 2,008 3,006 1,316 1,946 2,105 1,977 2,977 3,238 2,655 3,377 +27.2% 260 253 97 85 246 187 208 94 153 214 +39.9% Total 3,146 4,188 2,451 2,850 2,887 3,108 3,799 3,999 3,809 4,690 +23.1% In Canada, school bus sales were up in all categories in the 2013 sales year, with an overall increase of 23.1%. The total, 4,690 units, is the highest for Canada since at least 1996.